Quickstart
Eager to get started valuing some soccer actions? This page gives a quick introduction on how to get started.
Installation
First, make sure that socceraction is installed:
$ pip install socceraction[statsbomb]
For detailed instructions and other installation options, check out our detailed installation instructions.
Loading event stream data
First of all, you will need some data. Luckily, both StatsBomb and Wyscout provide a small freely available dataset. The data module of socceraction makes it trivial to load these datasets as Pandas DataFrames. In this short introduction, we will work with Statsbomb’s dataset of the 2018 World Cup.
import pandas as pd
from socceraction.data.statsbomb import StatsBombLoader

# Set up the StatsBomb data loader
SBL = StatsBombLoader()

# View all available competitions
df_competitions = SBL.competitions()

# Create a dataframe with all games from the 2018 World Cup
df_games = SBL.games(competition_id=43, season_id=3).set_index("game_id")
Note
Keep in mind that by using the public StatsBomb data you are agreeing to their user agreement.
For each game, you can then retrieve a dataframe containing the teams, all players that participated, and all events that were recorded in that game. Specifically, we’ll load the data from the third place play-off game between England and Belgium.
game_id = 8657
df_teams = SBL.teams(game_id)
df_players = SBL.players(game_id)
df_events = SBL.events(game_id)
Converting to SPADL actions
The event stream format is not well-suited for data analysis: some of the recorded information is irrelevant for valuing actions, each vendor uses their own custom format and definitions, and the events are stored as unstructured JSON objects. Therefore, socceraction uses the SPADL format for describing actions on the pitch. With the code below, you can convert the events to SPADL actions.
import socceraction.spadl as spadl

home_team_id = df_games.at[game_id, "home_team_id"]
df_actions = spadl.statsbomb.convert_to_actions(df_events, home_team_id)
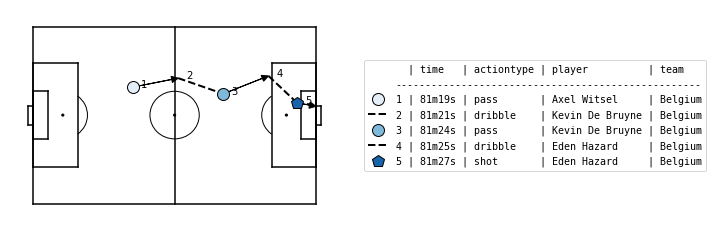
With the matplotsoccer package, you can try plotting some of these actions:
import matplotsoccer as mps

# Select relevant actions
df_actions_goal = df_actions.loc[2196:2200]
# Replace result, actiontype and bodypart IDs by their corresponding name
df_actions_goal = spadl.add_names(df_actions_goal)
# Add team and player names
df_actions_goal = df_actions_goal.merge(df_teams).merge(df_players)
# Create the plot
mps.actions(
    location=df_actions_goal[["start_x", "start_y", "end_x", "end_y"]],
    action_type=df_actions_goal.type_name,
    team=df_actions_goal.team_name,
    result=df_actions_goal.result_name == "success",
    label=df_actions_goal[["time_seconds", "type_name", "player_name", "team_name"]],
    labeltitle=["time", "actiontype", "player", "team"],
    zoom=False
)
Valuing actions
We can now assign a numeric value to each of these individual actions that quantifies how much the action contributed towards winning the game. Socceraction implements three frameworks for doing this: xT, VAEP and Atomic-Vaep. In this quickstart guide, we will focus on the xT framework.
The expected threat or xT model overlays a \(M \times N\) grid on the pitch in order to divide it into zones. Each zone \(z\) is then assigned a value \(xT(z)\) that reflects how threatening teams are at that location, in terms of scoring. An example grid is visualized below.
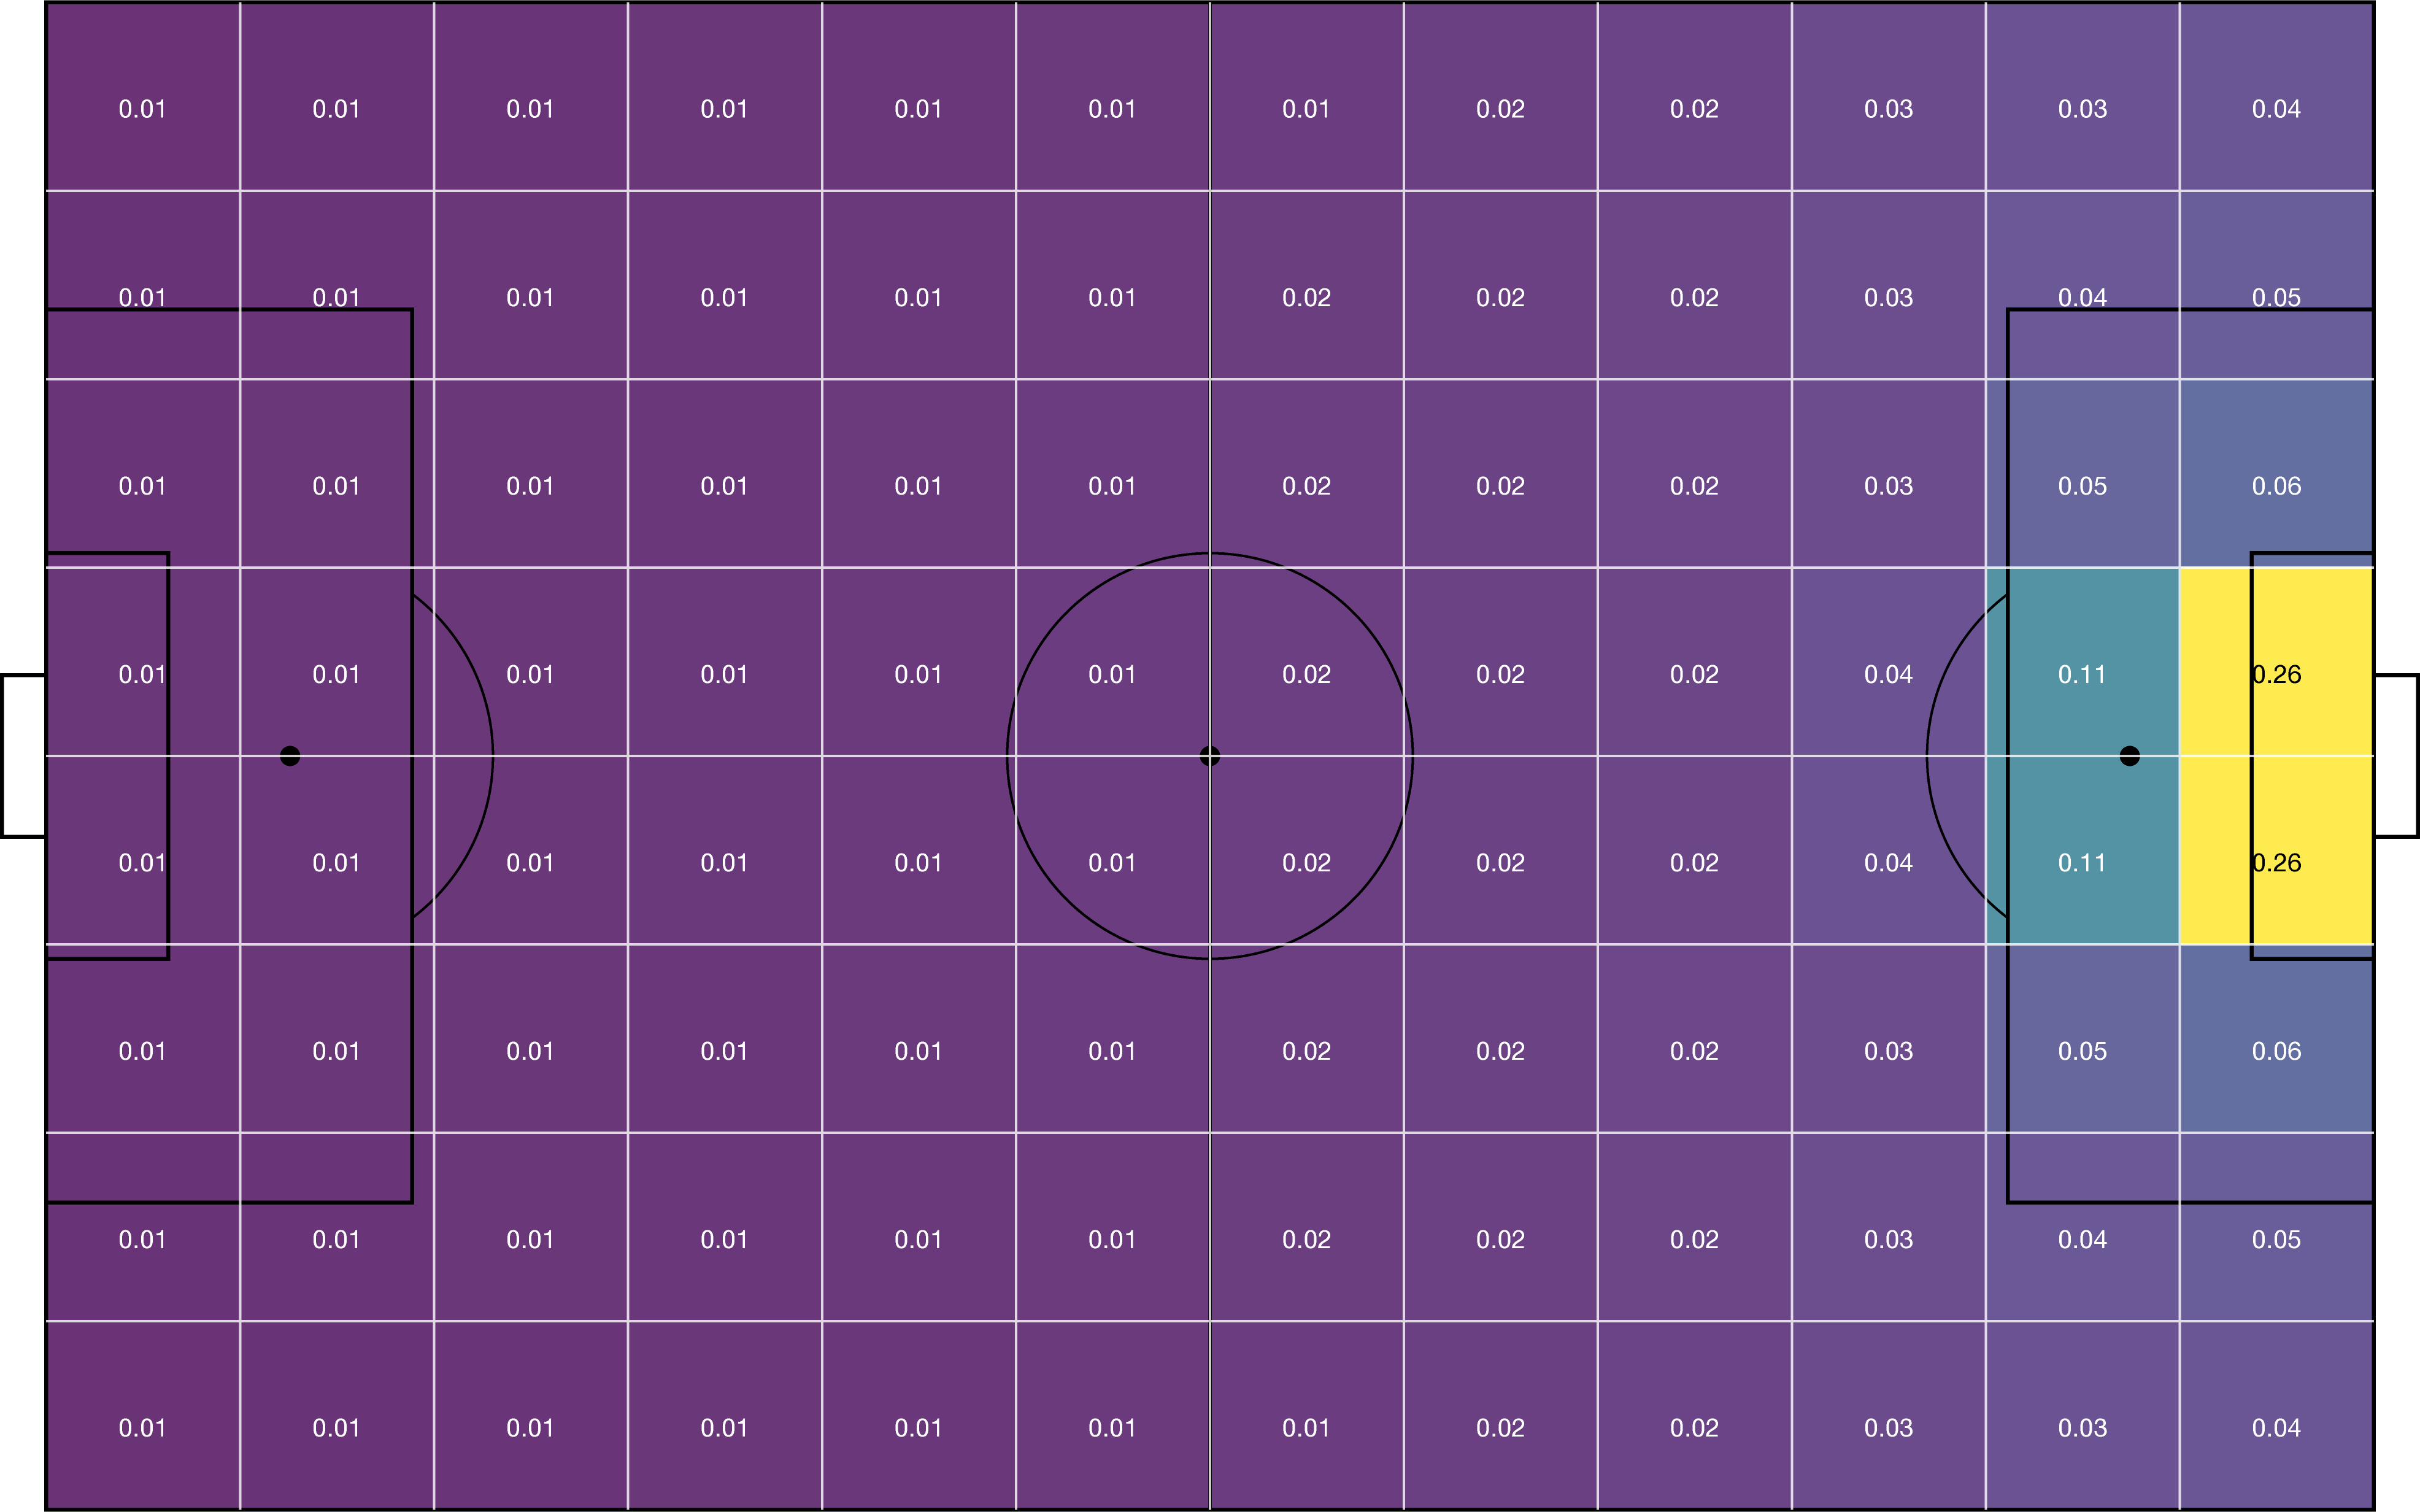
The code below allows you to load league-wide xT values from the 2017-18 Premier League season (the 12x8 grid shown above). Instructions on how to train your own model can be found in the detailed documentation about xT.
import socceraction.xthreat as xthreat

url_grid = "https://karun.in/blog/data/open_xt_12x8_v1.json"
xT_model = xthreat.load_model(url_grid)
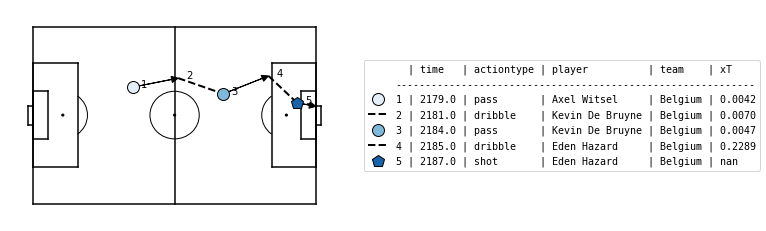
Subsequently, the model can be used to value actions that successfully move the ball between two zones by computing the difference between the threat value on the start and end location of each action. The xT framework does not assign a value to failed actions, shots and defensive actions such as tackles.
df_actions_ltr = spadl.play_left_to_right(df_actions, home_team_id)
df_actions["xT_value"] = xT_model.rate(df_actions_ltr)
Ready for more? Check out the detailed documentation about the data representation and action value frameworks.